LORENZ CURVE
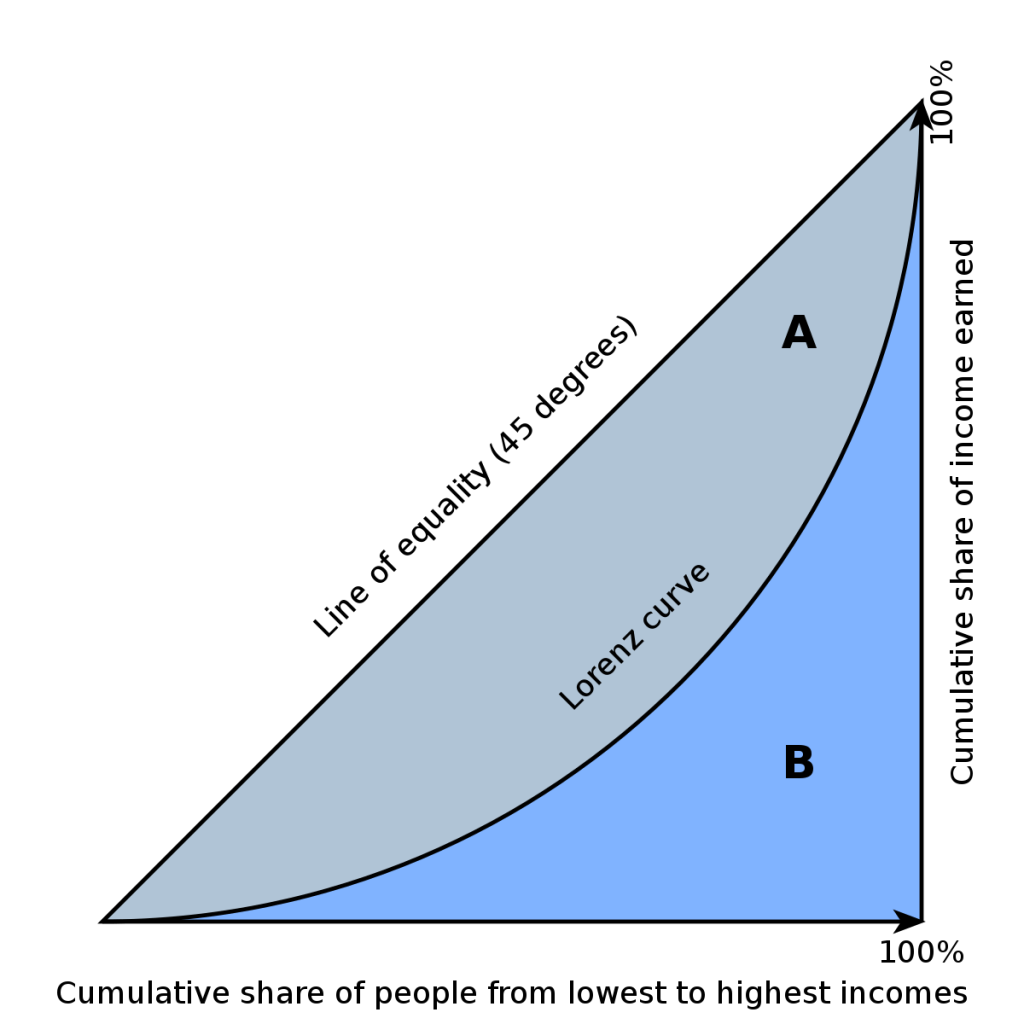
The lorenz curve is a graphical representation of income inequality or wealth inequality develop by American economist Max Lorenz in 1905.
It represents the perfect equality, wealth distribution, inequality of income and wealth too. Because it can happen that a income is at high rate, where as the wealth or the net worth at a lower side. May happen like a population with low income and high net worth.
The area between straight line and curved Expressed as a ratio called Gini Coefficient.
The coefficient ranges from 0 (or 0%) to 1 (or 100%), with 0 representing perfect equality and 1 representing perfect inequality. Values over 1 are not practically possible as we don’t take into account the negative incomes. (Income can be 0 at its lowest but not negative)
Thus, a country in which every resident has the same income would have an income Gini coefficient of 0. A country in which one resident earned all the income, while everyone else earned nothing, would have an income Gini coefficient of 1.
LAFFER CURVE
Taxes, nobody can move and feel comfortable from the havoc of taxes in any nation.
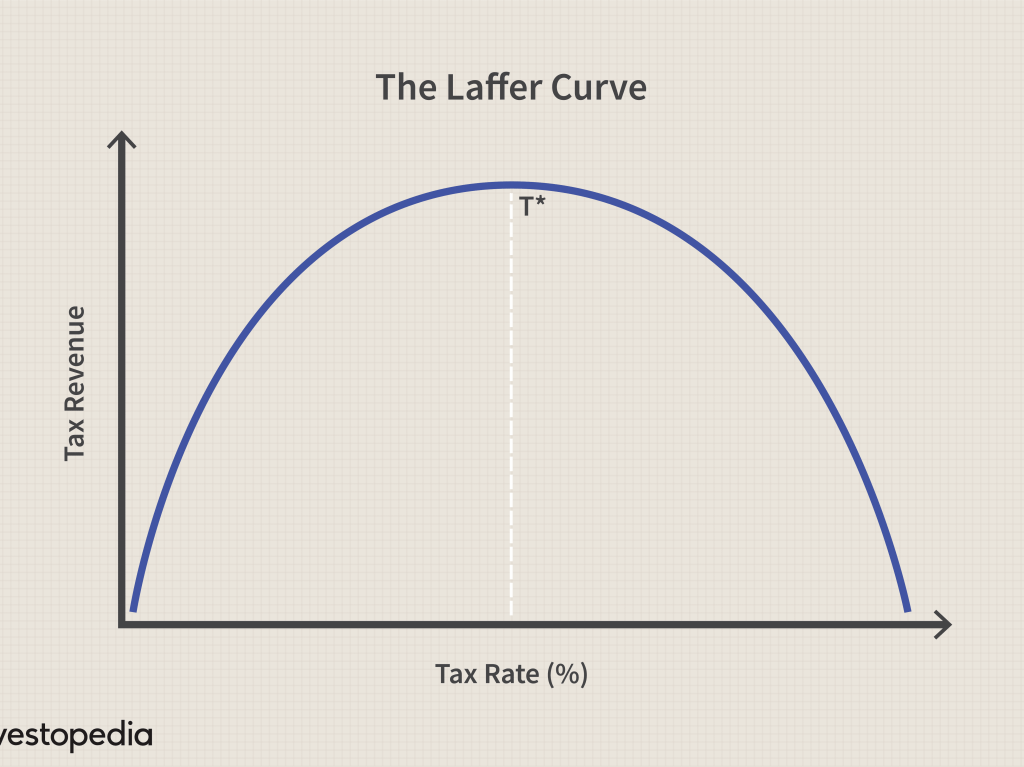
The Laffer Curve is a representative of tax reports. This theory was developed by supply-side ( supply – side is a kind of economic theory for Deflation) economist Arthur Laffer of USA.
The Laffer Curve describes the relationship between tax rates and total tax revenue, with an optimal tax rate that maximizes total government tax revenue.
If taxes are too high along the Laffer Curve, then they will discourage the taxed activities, such as work and investment, enough to actually reduce total tax revenue. In this case, cutting tax rates will both stimulate economic incentives and increase tax revenue.
If the tax rates are at 0% means tax revenue would be zero too. As the tax rates increase, tax revenue of gov. Increases. It a income to them, Eventually, if tax rates reached 100 percent, shown as the far right on the Laffer Curve, all people would choose not to work because everything they earned would go to the government. Therefore it is necessarily true that at some point in the range where tax revenue is positive, it must reach a maximum point.
